
Fluorolog
Scientific Product
Assistant Buniness Unit Manager : Miss. Rotsukon Chanseeharat
Tel : 081-988-2819
E-mail : rotsukon@pico.co.th
Admin
Tel : 02-939-5711 ext. 611
E-mail : scientific@pico.co.th
Overview
- Description
- Features
- FluorEssence Steady State and Frequency Domain Software
- DAS6 Decay Analysis Software
- DataStation TCSPC Acquisition Software
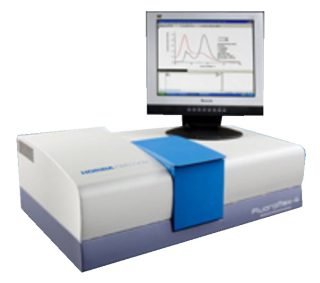
Description
The Fluorolog®-3 is a unique, modular system which allows the researcher to interchange a versatile range of accessories to correspond perfectly with the characteristics of a given sample. From analysis of steady-state or molecular dynamics to IR probes, the Fluorolog®-3 comes equipped with a wide range and limitless configuration of accessories to enhance the accuracy and speed of your application.
Features
- World’s most sensitive spectrofluorometer *
- Can detect 50-femtomolar fluorescein
- Unique, modular system adapts to new experiments or changing technology so is never obsolete
- Interchange wide range of computer-controlled accessories: spectrometers, detectors, sources, and more!
- Totally computer-controlled
- All-reflective optics so that the sample is in focus at all wavelengths
- Time-correlated single-photon counting (TCSPC) accessory for lifetime determinations
- Phosphorimeter accessory for long-lived luminescence determinations
* Finding it difficult to compare sensitivity specifications? We explain how to test your spectrofluorometer.
FluorEssence Steady State and Frequency Domain Software
FluorEssence – Steady State and Frequency Domain Software
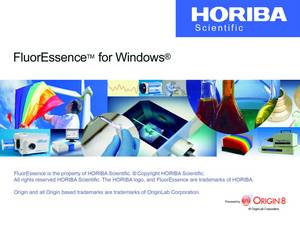
FluorEssence™ for Windows® sets a new standard for fluorescence software. FluorEssence™ merges spectrofluorometer data-acquisition directly to the famous processing power of Origin® software.
Simple clicks let you select a scan type, accessory or bring back a complete experimental set-up.
Revolutionize the Way You Operate Your Spectrofluorometer:
- Simplified windows make data-acquisition intuitive even to the casual user.
- With detector algebra, assemble input signals from different detectors into unique equations (including arithmetic or transcendental functions) that produce data in a format tailored to your application.
- Select the special Real Time Control (RTC) window to optimize your run parameters before actually scanning.
- Free video tutorials make FluorEssence™ even easier to learn.
- Run a variety of accessories including polarizers, microwell-plate readers, temperature baths, autotitrators, phosphorimeters, and more.
- Automatic correction for blanks and lamp output.
- Change units for temperature, wavelength, and slit-width with the click of a mouse.
FluorEssence™ also includes the powerful processing and data-management tools of Origin® to streamline your laboratory’s operation.
Data-viewing, plotting, processing and management are all available, including extensive import and export facilities, view manipulation and creation, arithmetic applications, peak-picking and integration, data-management and much more!
Software Features
- Data views in Workbook formats, keeping graphs, tables and notes together for each experiment
- Zooming and scaling
- Contour maps and profiles from 3D plots
- Integration/DerivativeFit fluorescence data to Gaussian, Lorentzian, and custom curves
- Standard arithmetic
- 3D perspective
- Smoothing
- Deconvolute
- Excitation/emission correction
- Interpolation and extrapolation
- Blank subtraction
- Normalization
- PLQY calculator wizard (for use with Quanta-Phi accessory)
DAS6 Decay Analysis Software
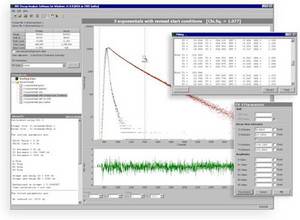
HORIBA Scientific decay analysis software recovers kinetic information (such as fluorescence lifetime and rotational correlation times) from luminescence decay data by fitting the raw decay data to one of a selection of kinetic models. Features such as shift iteration and reconvolution of instrument response function (IRF, or “lamp” profile) allow accurate recovery of multiple decay components even when the decay data is grossly distorted by the IRF.
DAS6 is designed to streamline the analysis of time-domain luminescence data, while still allowing for fine-tuning of parameters where necessary. Analysis modules include reconvolution analysis of multi-exponential models plus analysis of more specialised fluorescence decay processes as detailed below.
Multi-Exponential
Analysis for up to 5 exponentials.
Batch Exponential
Batch mode supports datasets containing up to 10,000 decays and is ideal for applications where large amounts of lifetime data are generated e.g. lifetime imaging and reaction monitoring. It features full reconvolution with up to five exponentials and shift iteration.
Global Exponential
Perform global analyses of up to 5 exponential components and 100 decay curves.
Distribution
Two methods are available for performing lifetime distribution analysis. The first method employs a “Top Hat” distribution function which allows a single lifetime distribution to be fitted in conjunction with an additional discrete lifetime. The second method is an optional module which will perform a Non-Extensive Decay distribution which allows up to five lifetime distributions to be modelled.
Exponential Series
Exponential series analysis of up to 30 terms. This allows parameterisation of otherwise difficult data.
Foerster Energy Transfer
2D and 3D Foerster type energy transfer with an optional exponential component.
Yokoto-Tanimoto Energy Transfer
Yokoto-Tanimoto energy transfer taking into account diffusion with an optional exponential component.
Micellar quenching
Micellar quenching kinetics can help determine the surfactant aggregation number.
Exciplex
Exciplex analysis follows formation of an excited state species.
Anisotropy analysis
Impulse reconvolution of up to 2 correlation times and 5 fluorescence decay components. Each model parameter, including shift, can be fixed at a pre-determined value or optimised as part of the parameter fitting. The use of reconvolution allows accurate determination of decay times and rotational correlation times even when the observed decay is grossly distorted by the duration of the excitation pulse.
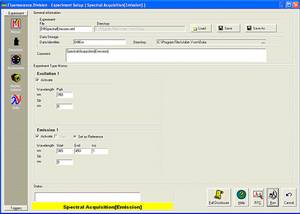
DataStation TCSPC Acquisition Software
![]()
DataStation is the latest measurement environment for time-domain fluorescence and is supplied with all HORIBA Scientific lifetime systems.
Lifetime systems are made up of various modules and components, including pulsed light sources, PMTs, monochromators, motorized polarizers, focusing optics, MCAs etc. DataStation integrates the control of all these components into one intuitive, mouse-driven Windows environment.
Lifetime systems can perform a variety of measurement functions, such as fluorescence decay measurement, phosphorescence decay measurement, time-resolved anisotropy measurements, steady-state spectra, time-resolved emission scan (TRES), temperature scans and more. These measurements are now routine using DataStation. Measurement templates are provided to quickly set up the instrument for the required measurement, and automated data acquisition is performed using computer controlled components.
Acquired data can be saved in a variety of formats including the .das format, HORIBA Jobin Yvon IBH v4.2, and ASCII, printed to your Windows printer, exported or copied to the clipboard for manipulation using a third-party application.
DataStation can be purchased separately for use on non-HORIBA Scientific systems, and we are happy to add custom functionality and interfacing (e.g. to additional monochromator types, motorized polarizer holders etc).
The DataStation software comes into its own when combined with a FluoroHub.
<h2b>Functionality
DataStation evolves continually as new functionality is added in response to customer suggestion. The following is a partial list:
Graphical
- Log or linear y-axis.
- Auto scaling y-axis.
- Multiple mouse zoom modes – x only, y only, x and y, pan, reset.
- Reversed time-axis mode (automatically reverses data during reversed-TAC mode measurements).
- Live display of cursor position, peak count, peak channel and total count.
- Detachable and customizable toolbars with helpful hints.
- Context-sensitive pop-up toolbars.
- Intuitive tree navigation for files and hardware settings.
- Tree navigation control window for FluoroHub control.
- Real-time estimated average lifetime during acquisition.
TCSPC mode
- Measurement presets – peak count or elapsed time.
- Multiple traces on screen simultaneously.
TRES mode
- Configure instrument for scan operation in just a few mouse clicks.
- Scan excitation or emission monochromator.
- Records 3D data (counts vs time vs wavelength) with live 3D progress display and interactive rotation.
- Manual and automatic data slicing.
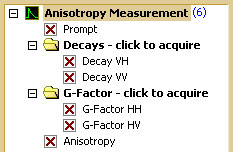
Anisotropy mode
- Target difference count.
- G-factor measurement.
MCA support
- Canberra/Tennelec PCA3.
- EG&G/Perkin Elmer Ortec Trump card.
Monochromator support
Polarizer support
- HORIBA Scientific 5000U-02 polarizers.
- PRA polarizers.
Temperature control support
- HORIBA Jobin Yvon IBH dipstick temperature controller (as accessory to HORIBA Scientific 5000 series system only).
- Cryostat (as accessory to HORIBA Scientific 5000 series system only).
System Requirements
The following PC specification are required to run DataStation. Measurement functionality depends on spectrometer hardware attached. Basic operation requires a supported MCA card or FluoroHub. Contact HORIBA Scientific for more information.
1 Gb RAM, 1 Gb HD space, DVD drive, 1024×768 graphics with minimum 256 color support, mouse or other pointing device. Windows™ XP or later (XP/Vista/7). Windows™ XP recommended.